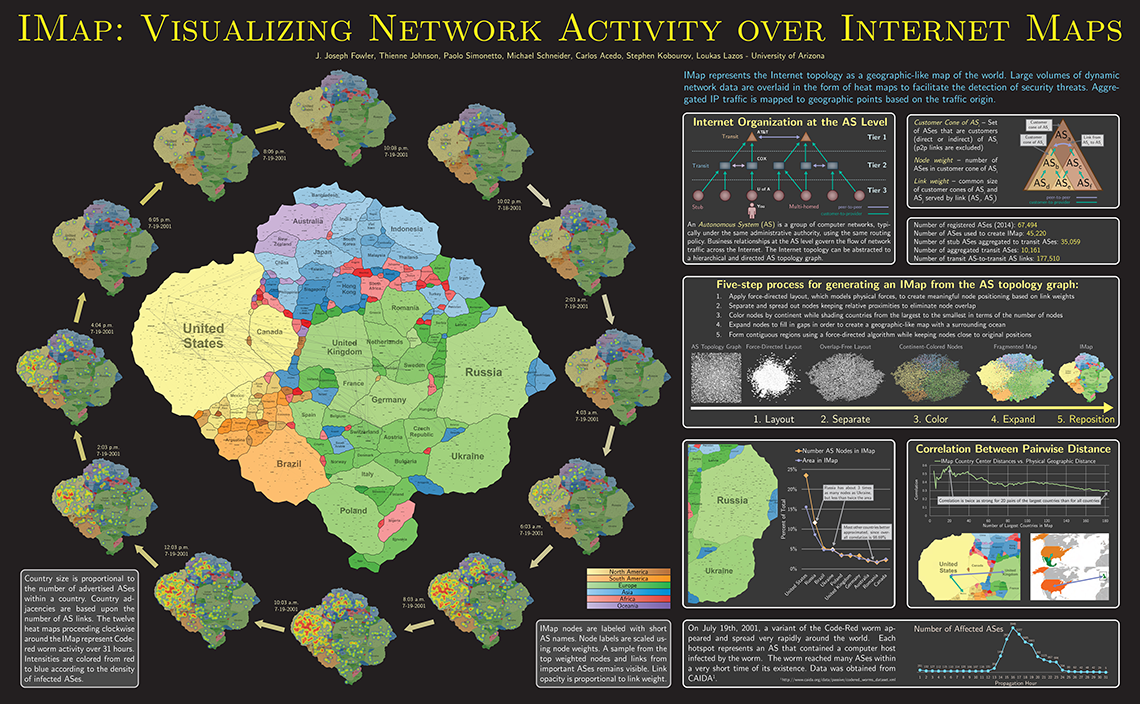
We present a novel technique, IMaps, for visualizing the Internet topology
based on Autonomous System (AS) connections and analyzing traffic metrics
and anomalies. The main component of this visualization technique is a
geographic-like map that depicts the AS topology. This map represents
world countries as contiguous regions of the plane, and ASes and their
connections with a node-link diagram. Shape, dimension and boundaries of
the countries do not reflect geography, but rather analogue
characteristics in the Internet space. Heatmaps are then overlaid to
visualize various types of dynamic data, such as aggregate network
activity statistics. To analyze AS nodes and detect network anomalies,
IP traffic is aggregated into AS nodes and we employ analysis per-AS,
so results (and AS heatmap colors) indicate the presence (or not) of
anomalies per AS.